 Entry
Entry Dashboard
 Contacts
 Properties
 Email
Email Calendar
 Tasks
Tasks Acquisition Cockpit
 Audit-proof mail archiving
 Automatic brochure dispatch
 Billing
 Groups
 Intranet
 Marketing Box
 Multi Property module
 Multilingual Module
 onOffice sync
 Presentation PDFs
 Process manager
 Project Management
 Property value analyses
 Enquiry Manager
 Showcase TV
 Smart site 2.0
 Statistic Tab
 Statistics toolbox
 Success Cockpit
 Time Tracking
 Address from clipboard
 Text block
 Customer communication
 External Tools
 Favorite links
 Calculating with formulas
 Mass update
 onOffice-MLS
 Portals
 Property import
 Quick Access
 Settings
 Templates
 Step by step
You are here: Home / Modules / Dashboard

Dashboard
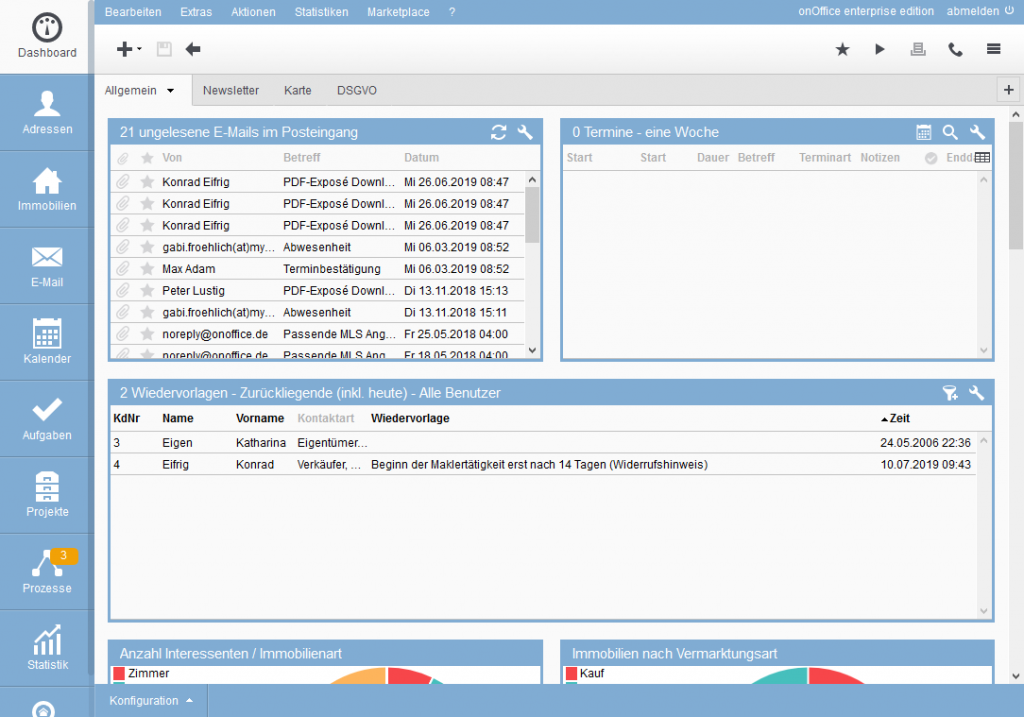
You can customize the dashboard by placing different widgets (windows) there. So you always have a quick overview of appointments, emails, follow-ups and tasks.
You can also display statistics as a widget on the dashboard.
The following widgets are available by default:
- Unread emails in the inbox
- Dates
- Follow-ups
- Tasks
Additional tabs can be added to the dashboard to group the widgets more clearly. The individual widgets can in turn be configured in different ways.
With the add-on module Statistics Construction Kit you can also add more statistics in separate tabs in the dashboard. For example, you can distribute certain statistics to all users without giving everyone access to the statistics toolbox . It is possible to switch to the display in the dashboard, but it is not possible to switch back to the statistics board. Please contact your sales contact person.
To differentiate, the statistic tabs on the left show the symbol of the statistics module ![]() .
.
The method of operation and configuration remains the same, it is explained in detail in the statistics module .