You are here: Home / Modules / Dashboard / Configure widgets / Address/mobile map widget
Address/mobile map widget
Dashboard
 Acquisition Cockpit
 API Module
 Audit-proof mail archiving
 Automatic brochure dispatch
 Automatic CSV export
 Billing
 Groups
 Intranet
 Marketing Box
 Multi Property module
 Multilingual Module
 Online feedback
 onOffice sync
 Presentation PDFs
 Process manager
 Project Management
 Property value analyses
 Enquiry Manager
 Showcase TV
 Smart site 2.0
 Statistic Tab
 Statistics toolbox
 Success Cockpit
 Telephone module
 Time Tracking
 Whatsapp Web
You are here: Home / Modules / Dashboard / Configure widgets / Address/mobile map widget

Dashboard
With the map widget you are able to display your properties, addresses and offices on a map worldwide. Active addresses and properties with valid location details are shown on the map. Units are not displayed.
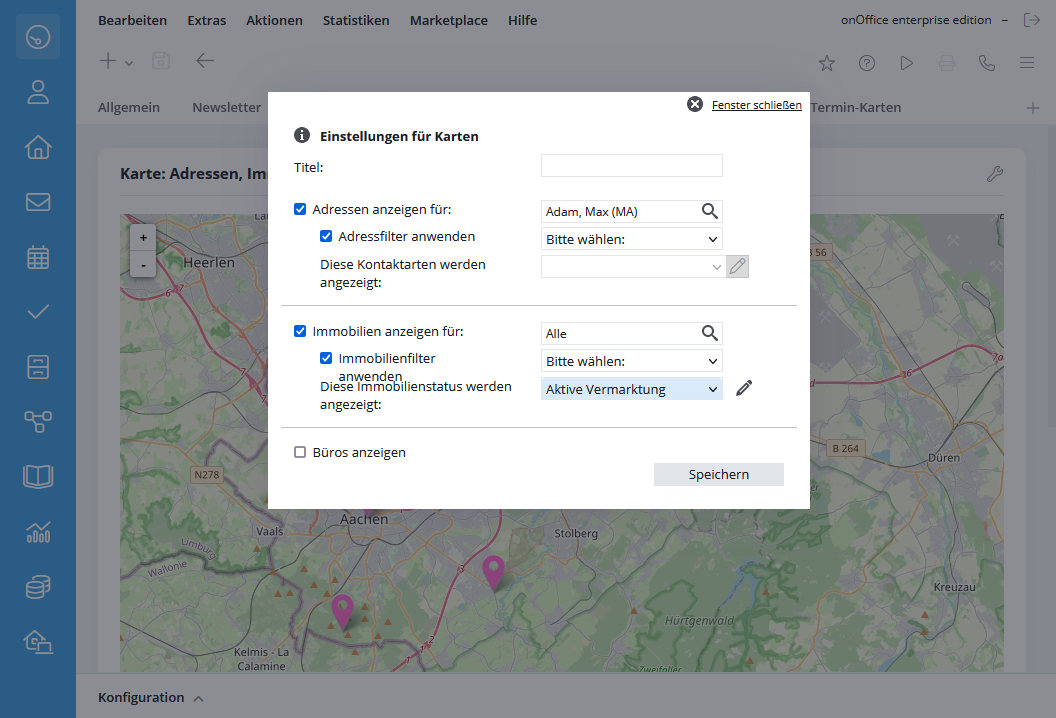
When the widget is created, the properties that have the status active are displayed by default. You can make further settings in the configuration dialog. This allows you to specify which administrator, addresses and/or properties are to be displayed. Only the data records for which you have read permission are displayed.
For addresses, you can restrict the display by specifying an address filter and a selection of contact types.
For properties, you can display the details of the various statuses or extended statuses (Status2) and restrict them using a property filter. You have the option of changing the color of the individual statuses in the administration as described in the expert box.
Please note that the maximum number of data records displayed per map widget for addresses and real estate is limited to 5000.
Notice:
You can change the size of the widgets, which is useful for the map widget.
The color of the pins varies depending on the type.
red – Addresses
blue– Office location
green– Real estate
For the extended property status or for the contact types of the addresses, individual colors can also be assigned per status/contact type in the administration. These are then displayed instead of the standard color for properties/addresses.
A pin is displayed at the corresponding location. Click on the pin to display the most important data for the address/property.
If there are too many pins in one place, a circle with the number of properties/addresses appears instead.
By clicking on the number you can ‘zoom in’, if you just position the mouse over it, a blue outline is drawn around the outer locations.
