You are here: Home / Additional modules / Statistic-Tab / Manage property / address statistics / Statistics: What numbers? How to display

Statistic-Tab

Statistics: What numbers? How to display

How to create, move or resize widgets is described in “Tabs and Tab Contents“.

Learn how to configure the statistics. You can use an existing template as an example, modify it and save it as your own template, or start with an “empty” template.
The sample templates contain information Icon mit Feldfilter with a short explanation of the statistics.

There are 2 types of statistics: First, we evaluate activity statistics (they are based on the entries in the agents log / activities). We will take a closer look at these in the following. On the other hand, there is the “Assigned Overview”, which is only displayed in tabular form. Their configuration is easier and is explained here only briefly.
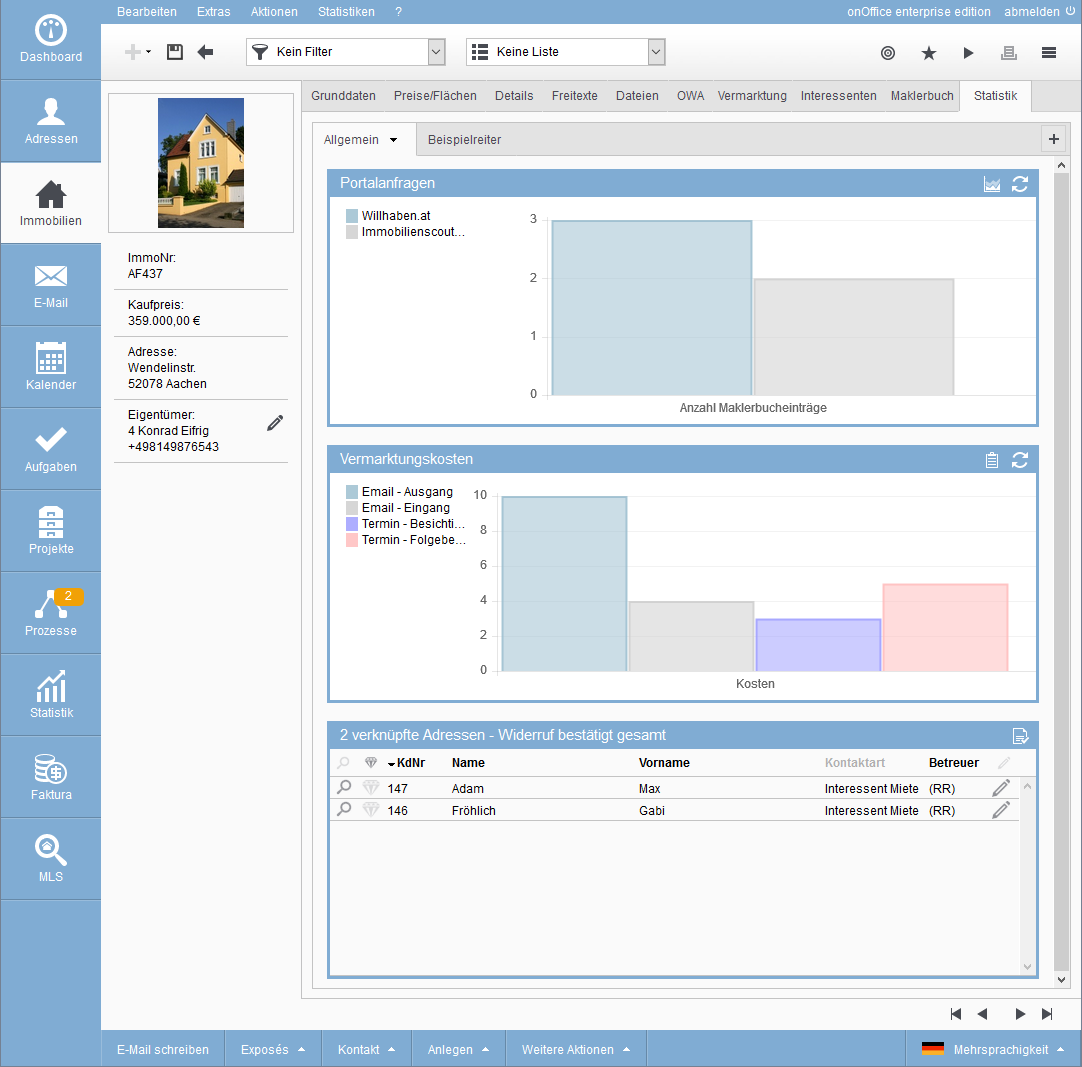
Open configuration

The configuration dialog of a statistics widget is opened via the Edit icon Schraubenschlüssel Symbol in the widget frame. You must be an administrator to configure it. You can read here how to configure the configurations and what you can set up there.
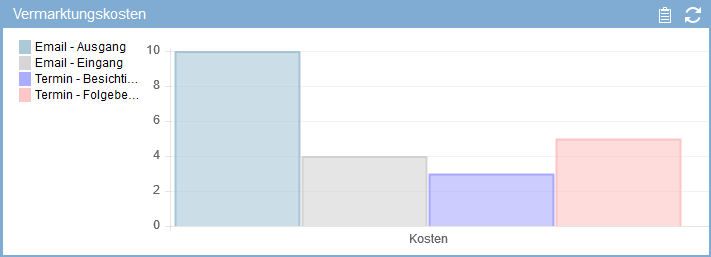
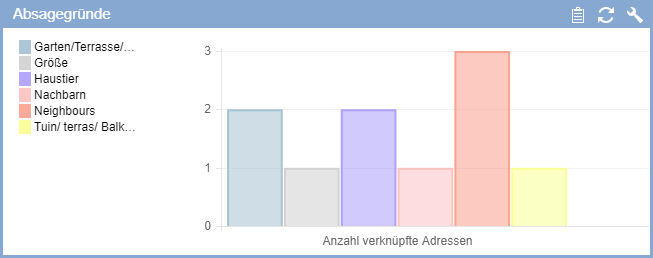
Statistics

Statistics can be displayed as a graph (bar, pie, line graph) or as a table. No matter which template or configuration you choose, either the number of entries is counted or the sum of the costs is calculated. This value is then displayed for the selected properties. Which properties and how they are counted is the important point. This is explained here using examples, a list of all configuration options can be found here.

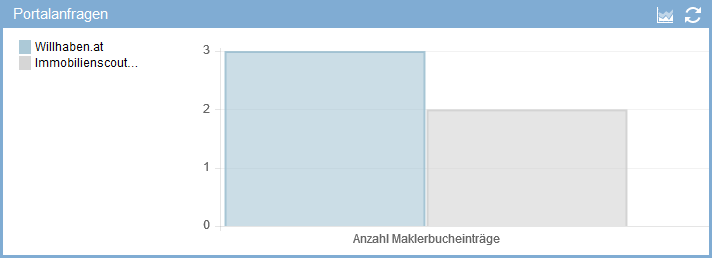
Example portal requests, what is counted and how?

The example “Portal requests” explains “What” and “How” is counted. This also determines what is displayed as X and what is displayed as Y in the graphical view.

The “Portal requests” widget is a property statistic in the form of a bar chart. It answers the question “How many requests have come for this property from which portal?
A bar is displayed for each portal from which a request came. The amount corresponds to the number of requests.

What is counted: Here in the example “Origin contact” was chosen as criterion.
In the “Settings” area of the configuration dialog, the criterion according to which the evaluation is to be performed is defined. Here you can select the information from the category “Activities” of the agents log entries. The criterion also determines whether the promotion is grouped or broken down by promotion type or category.

How to count: Here in the example, certain action types (email) and types (inbox) as well as an action characteristic (portal request) are selected. In the “Filter” section of the configuration dialog, you define which properties are displayed next to each other.

The most important point here is the activity filter behind the “Action type” field. A click on the pen opens the list with the activity tree. Only the existing action types are listed first. The plus symbol in front of the species can be used to expand the list. It can also be used to display the action types of this action type.

You can use the other filter options (characteristics, time period) to refine the statistics and display specific aspects. The configuration in the example excludes emails from other portals that have no entry in “Origin contact” from the count. Even emails that you write to other portals with an entry under “Origin contact” are not counted.

Output: What is displayed? In the example, the statistics have been configured as a bar chart. A bar is displayed for each portal in which “Contact” is entered as “Origin” for an “email” with “Inbox”.

Hints:

  1. Only the values for which entries exist are displayed. The number of displayed “bars” is automatically adjusted.
  2. You can use the “Addresses” or “property” filter to further restrict the agents log/activity entries to be evaluated.
  3. A mixture of action types and types has been configured in the activity filter.
    What is displayed?
    The selection of the criterion determines whether a breakdown is made by action type or action category.

Example marketing costs, counting or adding up?

The example “Marketing costs” explains how “Number of entries” and “Costs” differ as evaluation types.

The “Marketing Costs” widget is also a bar chart. The costs for all activities are displayed here. For each action type that exists as an entry and for which costs are stored, a further bar is added to the diagram.

Which settings are necessary?
In order for costs to be totaled, the costs must be entered for the individual entries. You can define costs for actions by default, or assign them to the entries manually. In the example “Marketing costs”, the costs of certain activities are summed up and broken down by action type.

For this purpose, the criterion “Which value is counted” > “Costs” must be selected. With “Filter” nothing is selected, thereby all entries are seized, with which costs are deposited.

In addition to the evaluation type “Costs” in the example “Marketing costs”, there is also the evaluation by number.
The number is differentiated according to the number of agents log entries (as in the example “Portal requests”) and according to the number of linked addresses (in the case of property statistics).

With the number of linked addresses, each address is counted only once, no matter how many entries are linked to this address.

Example: Rescission Confirmed Overall, Assigned Overview.

The “Assigned overview” displays a list of the address data records that have a connection to this property, that is, that are linked to the property via activities.

In this example, a filter is used to restrict the list to those who have confirmed the cancellation.

The “Assigned overview” not only evaluates addresses that are assigned in activities, it also evaluates the interested parties of a property (tab “Interested parties”, sub-tab “Manually assigned”).

Note:

Please remember that the list can only show addresses or properties that you are allowed to see.

Example reasons for rejection

Under “Reasons for cancellation” you will find a presentation of the reasons for cancellation chosen by the customer in the follow-up to the appointment. The number of linked addresses is displayed depending on the reason for rejection or the frequency distribution of certain reasons for rejection. This widget can be displayed as a diagram or table view. This enables you, for example, to assess which characteristic of the property hampers marketing and, if necessary, take appropriate measures.