You are here: Home / Additional modules / Statistics toolkit / Use statistics / Work with statistics / Statistics with average values
€

Statistics toolkit
Statistics with average values
Several examples will be used to explain how statistics can be used and how they can be changed via the configuration. There are several example pages for this under“Working with statistics“.
Another example is the evaluation of a property (and the average) as opposed to the number of data records. The declaration example is not available as a standard template.
By default, the number of data records is used to determine the key figures. However, all numerical fields (e.g. prices, areas, number of rooms, income) of the data records can be selected. In this case, the sum of the values from the field in the corresponding data records is determined as the key figure. If you are not interested in the total amount, but in the average value across all data records, please check the “Ø average” checkbox.
For example, the following key figures may be required: What is the average selling price of a semi-detached house? With more than five rooms? For a location in PLZ?
Answers to these questions can be determined using statistics. For this purpose, the purchase price is evaluated as an average rather than the number of data records.
In the “Settings” category, “Properties” is selected as the module and the “Purchase price” and “Average” checkboxes are set for “To be evaluated”.
In the “Grouping” category, a (previously created) filter is added for the property type “House” and the marketing type “Purchase”.
In the “Evaluation” category, “Live values with temporal reference” is selected and the “Offline since”, “In month” and “Exclude blank values” fields are set in the “Temporal reference” category. The month on which the property was removed from all portals is taken as the date of sale.
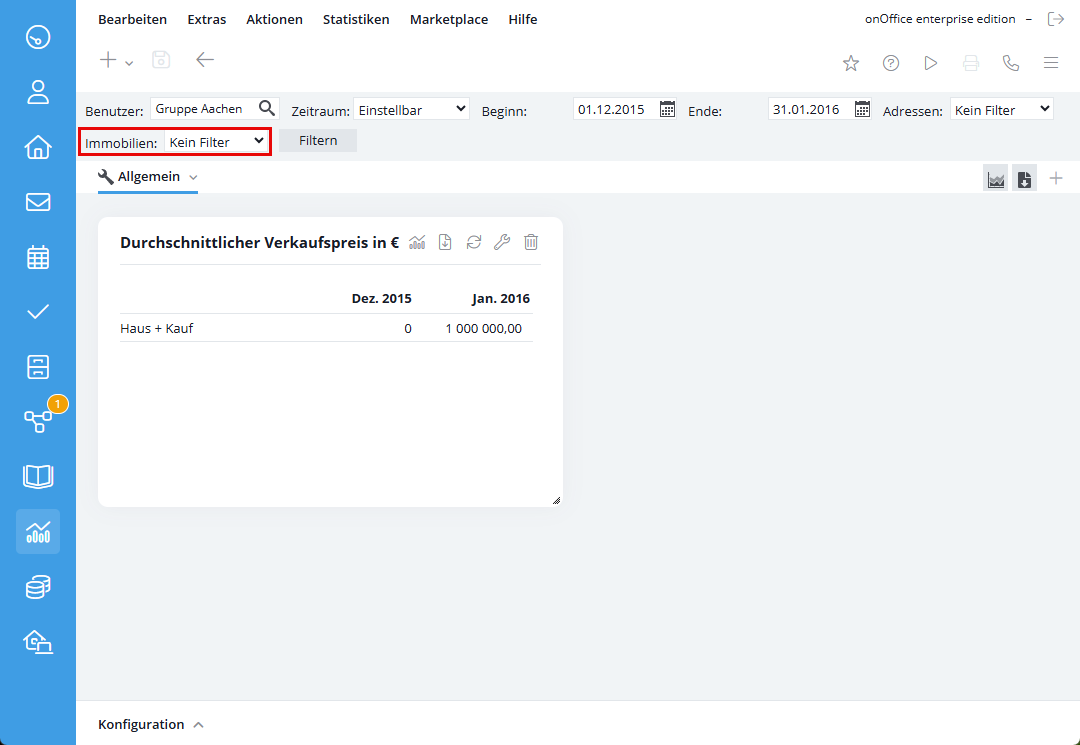
At the moment, the statistics show the average sales price of the houses that were sold in the month in question.
If only the average sales price of all houses (regardless of whether they have been sold for a long time or are currently being marketed) is to be determined, then the Evaluation category is set to “Live values” and all other settings are omitted.
The condition “Properties with more than 5 rooms” should be added via the filter bar. It is then easily possible to replace the condition “properties with more than 5 rooms” with the condition “located in zip code area” without changing the statistics themselves via the configuration.
The finished statistics are shown in the following image.
If necessary, the configuration of the statistics for the “Temporal reference” could be adjusted or the key figures for single-family houses, apartments, etc. could be added.
Without changing the configuration of the statistics, an office group could be selected via the filter bar for users in order to obtain the key figures for a specific office, etc.

 Entry
Entry Dashboard
 Contacts
 Properties
 Email
Email Calendar
 Tasks
Tasks Acquisition Cockpit
 Audit-proof mail archiving
 Automatic brochure dispatch
 Billing
 Groups
 Intranet
 Marketing Box
 Multi Property module
 Multilingual Module
 onOffice sync
 Presentation PDFs
 Process manager
 Project Management
 Property value analyses
 Enquiry Manager
 Showcase TV
 Smart site 2.0
 Statistic Tab
 Statistics toolbox
 Success Cockpit
 Time Tracking
 Address from clipboard
 Text block
 Customer communication
 External Tools
 Favorite links
 Calculating with formulas
 Mass update
 onOffice-MLS
 Portals
 Property import
 Quick Access
 Settings
 Templates
 Step by step
