 Entry
Entry Dashboard
 Contacts
 Properties
 Email
Email Calendar
 Tasks
Tasks Acquisition Cockpit
 Audit-proof mail archiving
 Automatic brochure dispatch
 Billing
 Groups
 Intranet
 Marketing Box
 Multi Property module
 Multilingual Module
 onOffice sync
 Presentation PDFs
 Process manager
 Project Management
 Property value analyses
 Enquiry Manager
 Showcase TV
 Smart site 2.0
 Statistic Tab
 Statistics toolbox
 Success Cockpit
 Time Tracking
 Address from clipboard
 Text block
 Customer communication
 External Tools
 Favorite links
 Calculating with formulas
 Mass update
 onOffice-MLS
 Portals
 Property import
 Quick Access
 Settings
 Templates
 Step by step
You are here: Home / Additional modules / Statistics toolkit / Use statistics / Work with statistics / User ranking

Statistics toolkit
User ranking


Other options are “Configure column” and “Delete column”. Using the icons ![]() you can hide the column to be edited and set the sorting Ascending
you can hide the column to be edited and set the sorting Ascending ![]() or Descending
or Descending ![]() . The sorting can only be set for one column.
. The sorting can only be set for one column.
“Apply” saves both the stored configuration and the definition of the column.
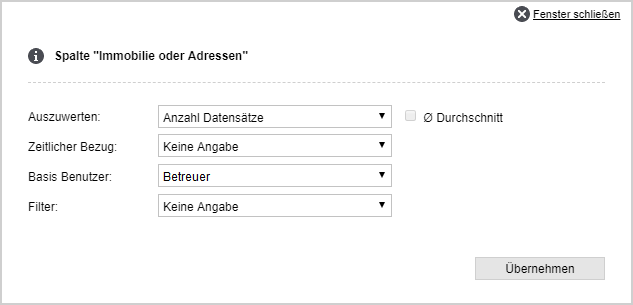
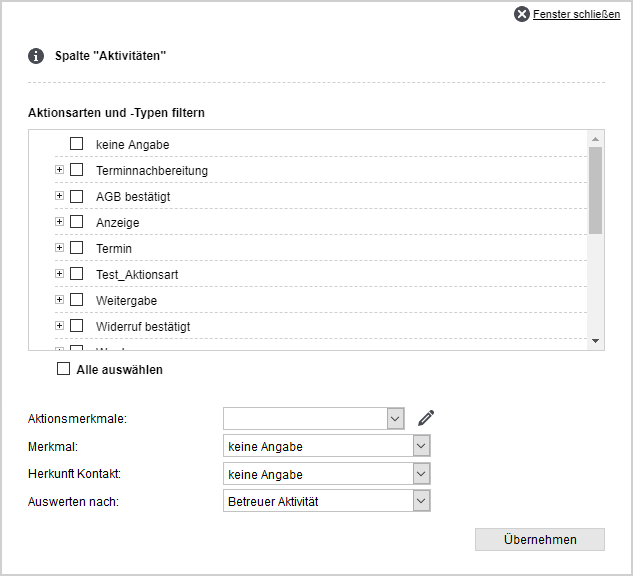
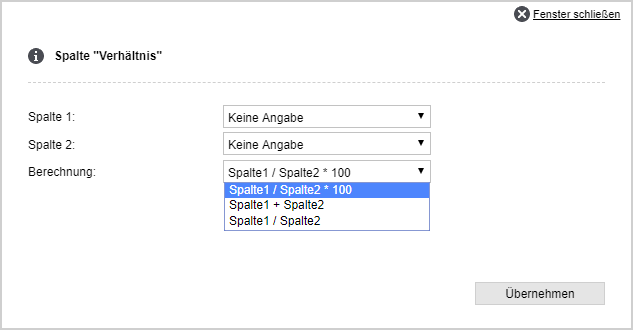
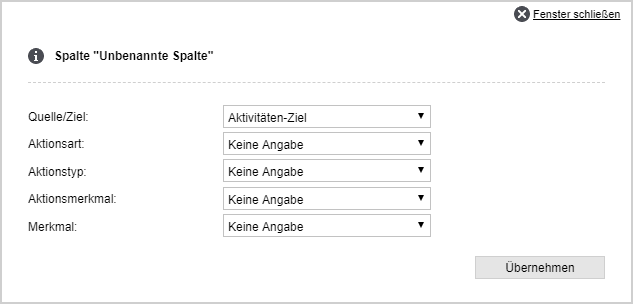
Column configuration
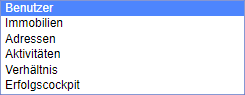
In the user statistics you can choose from 5 different column types, all of which can be configured differently.
- Contacts
- Property
- Activities
- Ratio
- User
- Success cockpit (if available in the client)
Statistics toolkit